Area Monitoring Application
Area Monitoring App is a web application that aggregates data from connected systems in order to provide the ability for viewing the information on markers and Traffic Light System (TLS) decisions of a Feature of Interest (FOI) and is part of the Area Monitoring System.
Trial access
If you would like to check the Area Monitoring App application and interactively explore various markers, do contact us and we will provide you credentials.
Basic navigation
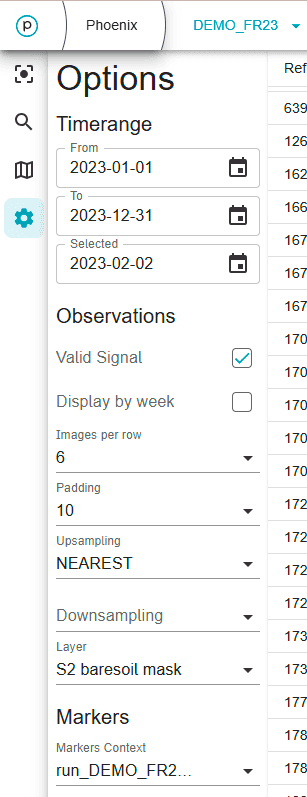
At the left of the interface, you can select the scope (DEMO_FR23 in this case), limit the timerange of the observations, observations layer and select marker context.
FOI selection
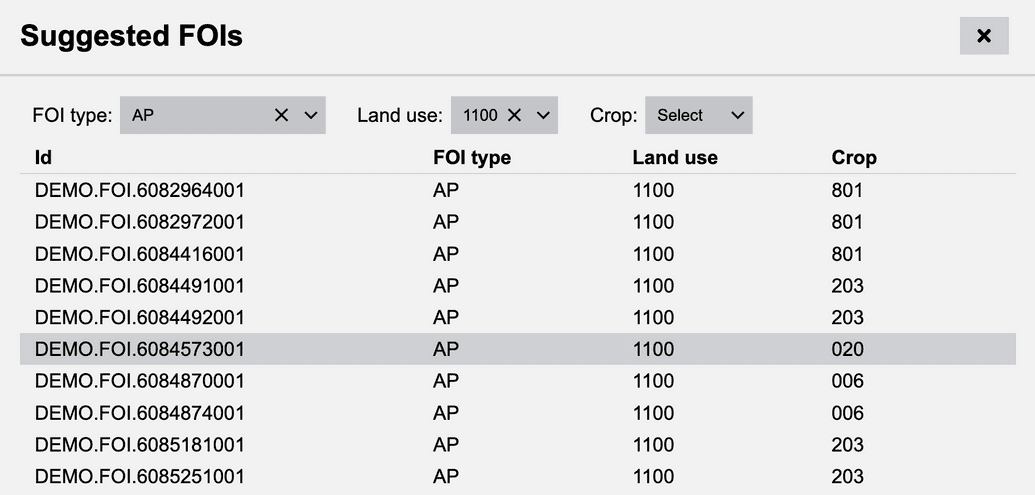
Select one of the suggested FOIs
- Select the scope from the drop-down list.
Scope defines the geographical data and temporal intervals that will be available for selection and restricts the options in subsequent filters. Note that with the trial access, you will be limited to the
DEMOscope.
(Optional) Filter the suggested FOIs by FOI type, land use or crop type.
Select a FOI from the list.
Select a FOI with a specific id
Select the scope from the drop-down list.
Select the FOI type from the drop-down list.
FOI type selection is not needed if you provide the full FOI reference Id (e.g.
DEMO.FOI.6999931001) in the input field next to the FOI type drop-down. Note that you have only one type available in theDEMOscope, i.e.AP- agricultural parcel.
Enter the FOI Id.
Press the Search button.
Temporal selection
(Optional) Shorten the default timespan and press the Search button. When a valid FOI Id is entered, the timespan will be populated automatically and override the user's setting.
(Optional) Select the Marker context from the drop-down menu.
Different marker contexts are available in case of several calculations of the markers within the season. Note that with the trial access, you will be limited to one marker context.
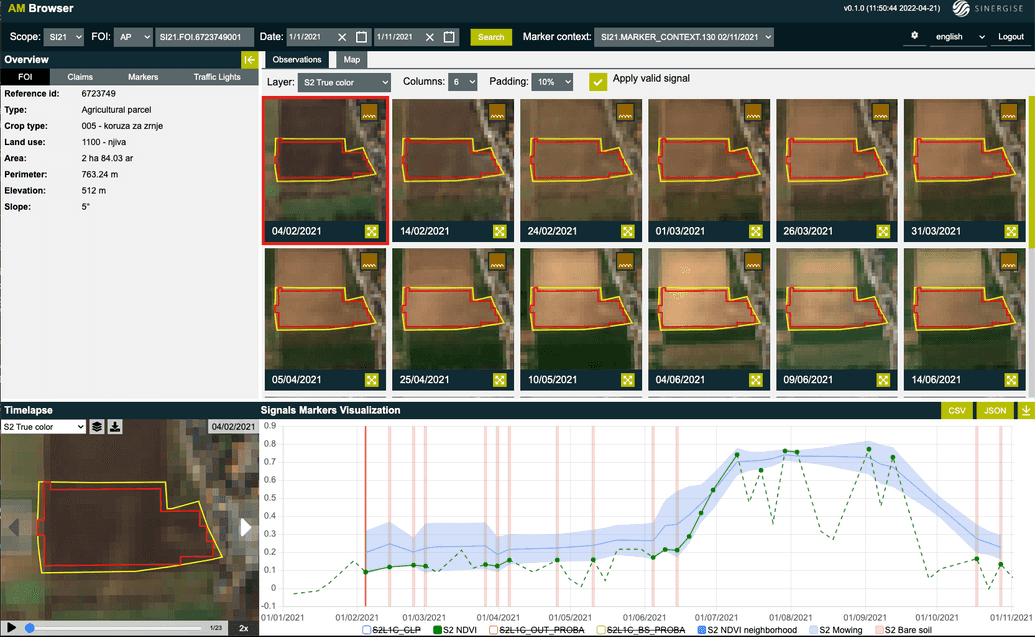
All of the information available for the selected FOI is displayed in several widgets.
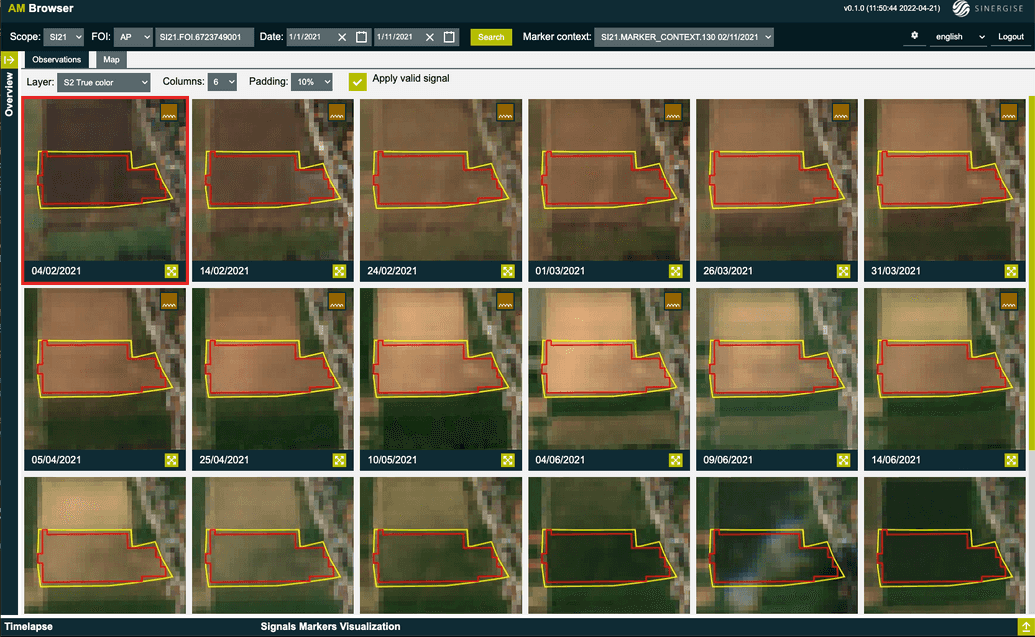
Collapse or expand widgets
(Optional) Click on the corresponding section header with a collapse/expand arrow to collapse or expand widgets located within the same section.
Widgets
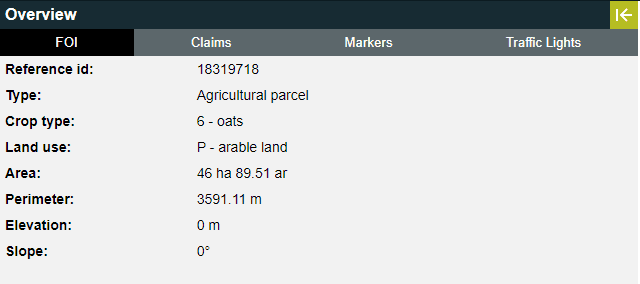
FOI
FOI widget shows the general information about the selected FOI.
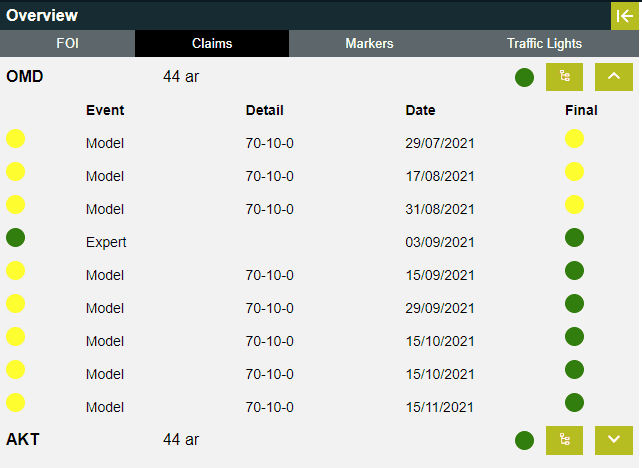
Claims
Claims widget shows all the claims associated with the selected FOI. The last column shows the latest assigned traffic light decision, if available, and the TLS diagram used to make the decision.
 Click on the
 Diagram buttom opens in a new browser tab the TLS diagram used to make the latest traffic light decision assigned to the claim.
To show/hide all the traffic light decisions assigned to a specific claim, click on expand/collapse arrow.
Markers
The Markers widget group shows the following widgets: Summary, Land cover group, Distance, Similarity, Crop group and Pixel Mowing. Each of these can display information from more than one data source, if available (for example, S2 = Sentinel-2, PF = PlanetFusion).
Summary
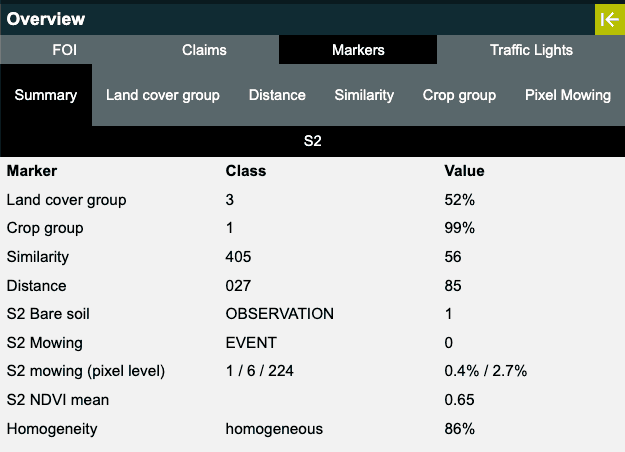
Summary widget displays information for the markers listed below:
Land cover group- predicted land cover group and confidence in the predictionCrop group- predicted crop group and confidence in the predictionSimilarity- most similar crop type according to the similarity marker and its score (the lower the number, the more similar)Distance- most similar crop type according to the distance marker and its score (the lower the number, the more similar)Bare soil- number of bare soil observations within the scope timespanMowing- number of detected mowing events within the scope timespanMowing (pixel level)- first three numbers (1 / 6 / 224 on the screenshot above) present:
- largest number of spatially connected pixels with detected mowing events,
- number of all pixels with mowing detected,
- number of full pixels in FOI pixelized geometry.
- the 2 numbers on the right (0.4% / 2.7% on the screenshot above) present:
- largest number of spatially connected pixels with detected mowing events divided by total number of pixels,
- number of all pixels with mowing detected divided by total number of pixels.
- first three numbers (1 / 6 / 224 on the screenshot above) present:
NDVI mean- mean NDVI value of all valid observations per FOI within the scope timespanHomogeneity- predicted homogeneity (or non-homogeneity) and confidence in the prediction
Land cover group and Crop group
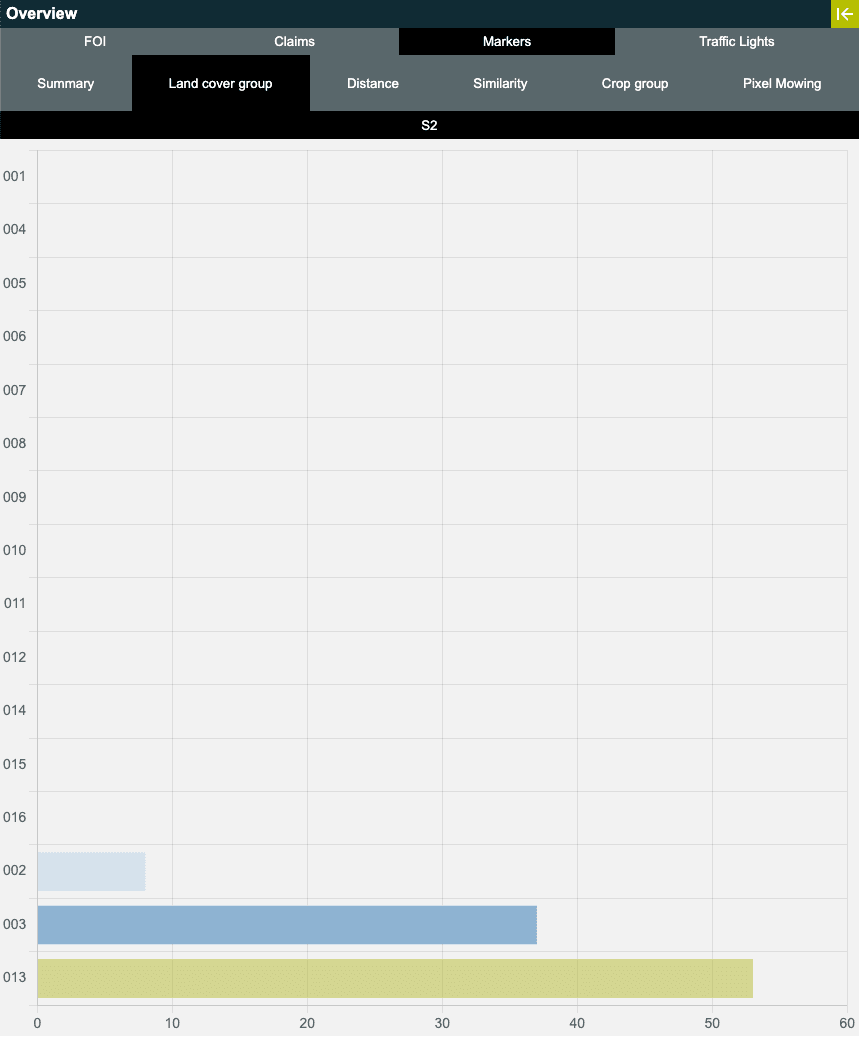
Under the Land cover group widget, classification scores for all land cover classes are presented graphically (see Marker Scores visualization component for more information). The predicted land cover group is rendered in green. If the declared land cover is not the same as the predicted one, it is rendered in darker blue color. The same principle is in use for presenting classification scores for all crop groups in the Crop group widget.
Distance and Similarity
Under the Distance widget, the scores for all crops are presented graphically (see Marker Scores visualization component for more information).
The most similar crop is rendered in green. If the declared crop is not the most similar one, it is rendered in darker blue color. The same principle is in use for presenting similarity marker scores in the Similarity widget.
Traffic Lights
In the Traffic Lights widget, you can see all traffic light calculations performed for the selected FOI.
 Clicking the
 Show diagram button displays the TLS diagram in a new browser tab.
Observations
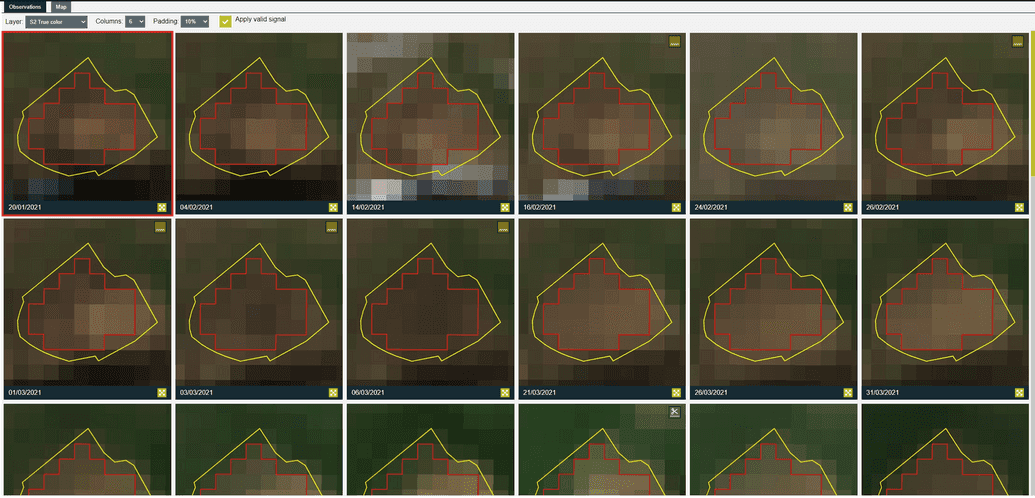
In the Observations widget, you can see all available image chips for the selected FOI and selected layer (by default, only valid observations are shown).
In the options row, you can choose:
- the desired layer,
- the number of columns used for laying out observation images,
- padding of the image chip around FOI geometry and
- whether images are filtered using the valid signal or not.
 Clicking the image chip displays it in a new pop-up window that can be dragged or resized.
Map
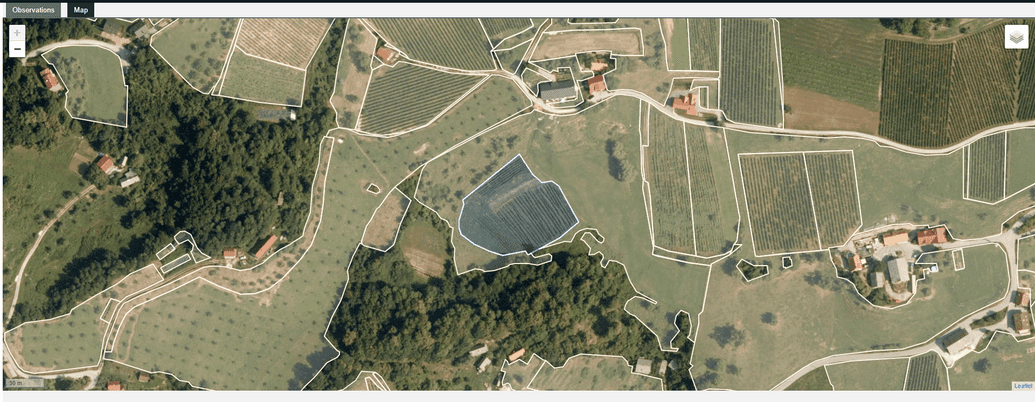
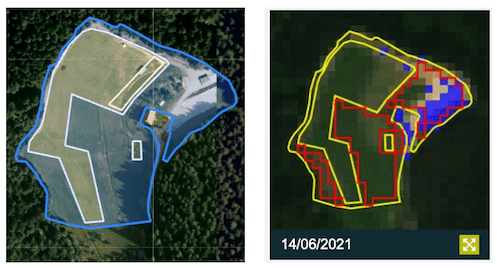
In the Map Widget, you can see the selected FOI and the neighboring FOIs.
If you move the map around, all available FOIs in the area will be displayed, to a certain zoom level. Clicking on any of the FOIs shown on the map will display the data related to that FOI in all widgets.
 In the top right, you can select various
 Map options:
- Choose if you wish to display the selected FOI with a yellow outline (so it stands out compared to other FOIs in the area) or not.
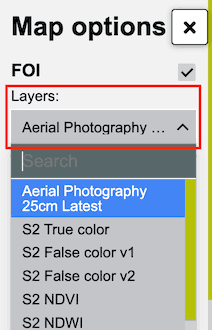
- Select the background Layer - Aerial Photography, S2 True Color, S2 False Color, etc. If a satellite imagery is selected as a background, you can set the timestamp by clicking on the specific date in the
Signals Markers Visualizationwidget.
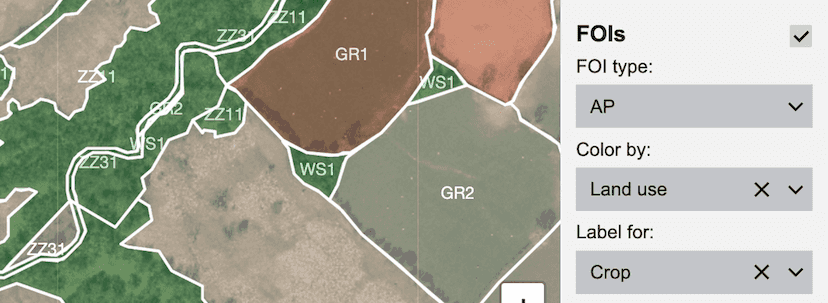
- Choose how you wish to display the neighbouring FOIs: show them or not, colour them by crop type or land use type, display the labels for the crop type or land use type.
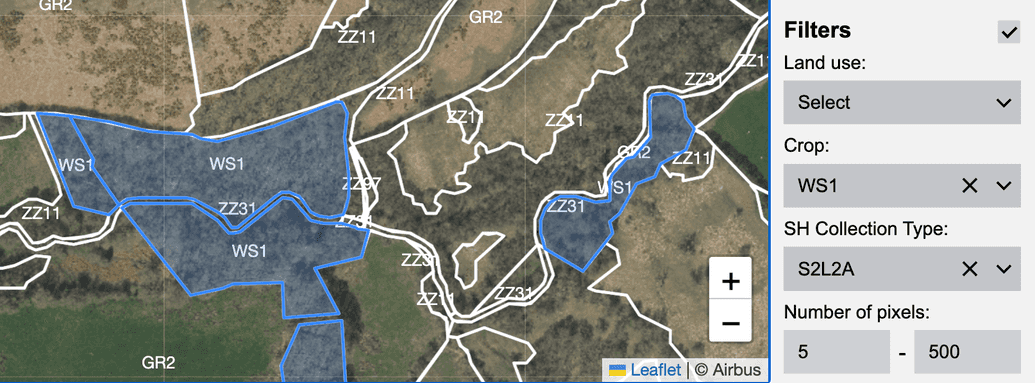
- Set Filters to display the FOIs matching the specified criteria with a blue outline so that they stand out compared to other FOIs (white outline) in the area. A filter can be applied to crop type, land use type, number of pixels or to a combination of these properties.
Timelapse
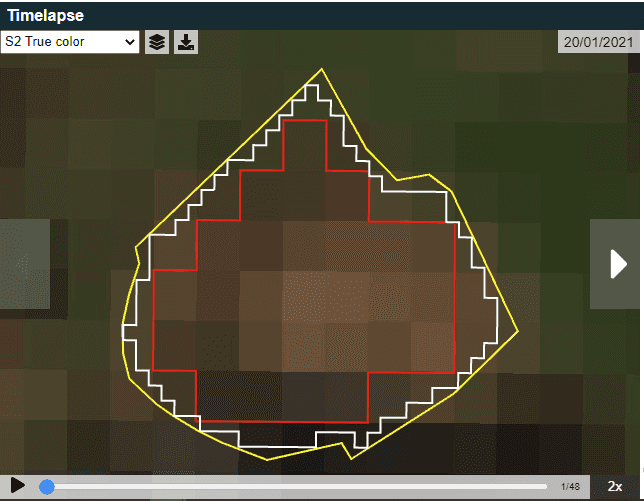
In the Timelapse widget (see Timelapse visualization component for more information), you can see the timelapse of the selected FOI's image chips for the selected layer. You can download the timelapse as a GIF file. You can either play the timelapse or navigate from one image chip to the next one.
Signals Markers Visualizations
In the Signals Markers Visualization widget (see Signal Marker Visualization component for more information), you can see the graph of all available and selected signals and markers for the selected FOI and for the marker context in the selected period.
 Clicking on the
 CSV button downloads all available data in a CSV format.
 Clicking on the
 JSON button displays all available data in JSON format in a new browser tab.
 Settings are available by clicking on the "Settings" icon in the bottom right. Here you can choose between several options of where the tooltip should be placed when hovering over points in the timeline.

The Legend is below the graph, showing which signals and markers are available.
Left clicking on a label will toggle on and off the items shown on the graph. If indicated by a colored square, the item is shown on the graph.
Ctrl/cmd + Left clicking on a label will toggle on and off the items included in the tooltip. If indicated by bold text, the item is included in the tooltip.
Sentinel 2 visualisations
You can choose between different visualitations of the Sentinel 2 imagery in the Observations, Map and Timelapse widgets.
S2 True color
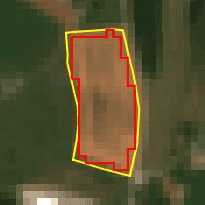
True color composite: Sentinel-2 has 13 bands. True color composite uses visible light bands red, green and blue in the corresponding red, green and blue color channels, resulting in a natural colored product, that is a good representation of the Earth as humans would see it naturally.
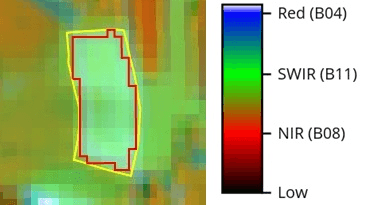
S2 False color v1
False color composite: The false color composite using near infrared, red and green bands is most commonly used to assess plant density and health, since plants reflect near infrared and green light, while they absorb red.
S2 False color v2
False color composite with enhanced contrast: The false color composite using near infrared, red and green bands, but other color channels than the S2 False color v1.
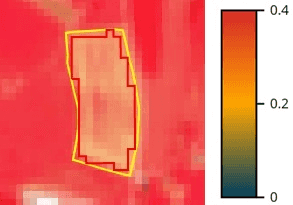
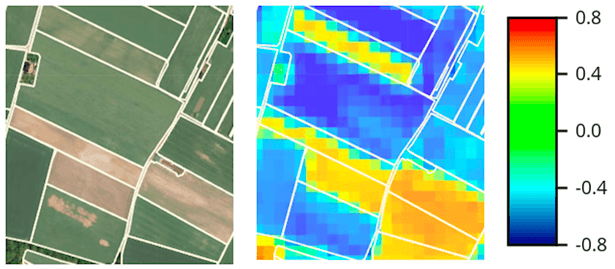
S2 NDVI - Normalized Difference Vegetation Index (NDVI)
The normalized difference vegetation index is a simple, but effective index for quantifying green vegetation. It is a measure of the state of vegetation health based on how plants reflect light at certain wavelengths. The value range of the NDVI is -1 to 1. Negative values of NDVI (values approaching -1) correspond to water. Values close to zero (-0.1to 0.1) generally correspond to barren areas of rock, sand, or snow. Low, positive values represent shrub and grassland (approximately 0.2 to 0.4), while high values indicate temperate and tropical rainforests (values approaching 1).
S2 CCC - Canopy Chlorophyll Content
CCC (Canopy Chlorophyll Content []) is calculated here as the product of the leaf area index (LAI) with the leaf cholrophyll content (Cab). Visualized as an interval from 0-900.
S2 EVI - Enhanced Vegetation Index
In areas of dense canopy cover, where leaf area index (LAI) is high, the blue wavelengths can be used to improve the accuracy of NDVI, as it corrects for soil background signals and atmospheric influences. Values description: The range of values for EVI is -1 to 1, with healthy vegetation generally around 0.20 to 0.80.
S2 LAI - Leaf Area Index
LAI is a dimensionless index measuring the one-sided green leaf area over a unit of land []. Visualized as an interval from 0-3.
S2 NDWI - Normalized Difference Water Index (NDWI)
The normalized difference water index is most appropriate for water body mapping. Values of water bodies are larger than 0.5. Vegetation has smaller values. Built-up features have positive values between zero and 0.2.
S2 Moisture index (NDMI)
NDMI is a normalized difference moisture index, that uses NIR and SWIR bands to display moisture. In short, NDMI is used to monitor changes in water content of leaves.
S2 NDSI - Normalised Difference Snow Index (NDSI)
The Sentinel-2 normalised difference snow index can be used to differentiate between cloud and snow cover as snow absorbs in the short-wave infrared light, but reflects the visible light, whereas cloud is generally reflective in both wavelengths. Snow cover is represented in bright vivid blue.
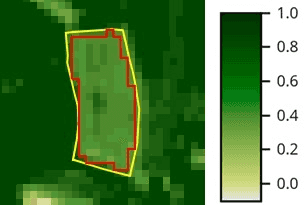
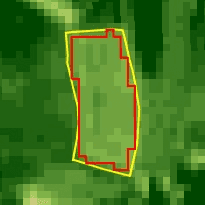
S2 CL_GREEN_V2
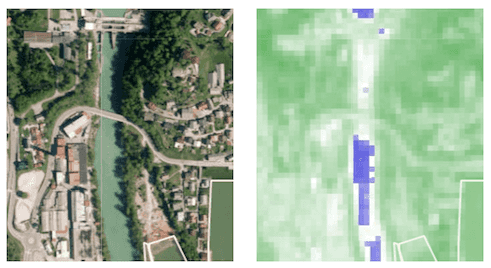
S2 CL_GREEN_V2 Chlorophyll Index visualisation is tailored for monitoring agricultural areas by visualizing the chlorophyll content in vegetation. Chlorophyll levels are a key indicator of plant health and vitality, making this index valuable for assessing crop conditions. For example, it shows the subtle differences in the state of the vegetation after the area was mowed. The index is mapped to a color gradient that visually represents different levels of chlorophyll content. Dark green colors indicate higher chlorophyll content, suggesting healthier, more vigorous vegetation, while light green colors represent lower chlorophyll levels.
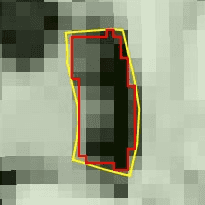
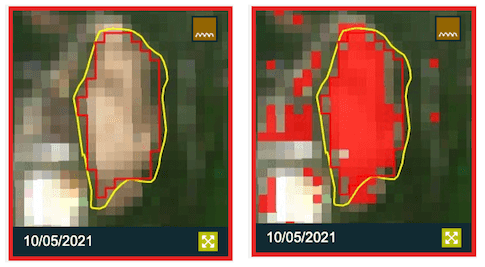
S2 baresoil mask and S2 built-up mask
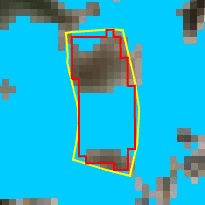
We have developed a set of binary land-cover classifiers that are able to give insights into the land-cover of each pixel of a FOI. These are: built-up mask, bare-soil mask, forest mask and water mask. The combination of these binary land-cover classifiers gives us our own proprietary on-demand scene classification map that can be applied to any single Sentinel-2 observation.
Built-up mask (blue pixels)
Baresoil mask (red pixels)
