Bare-Soil Marker
Basic info
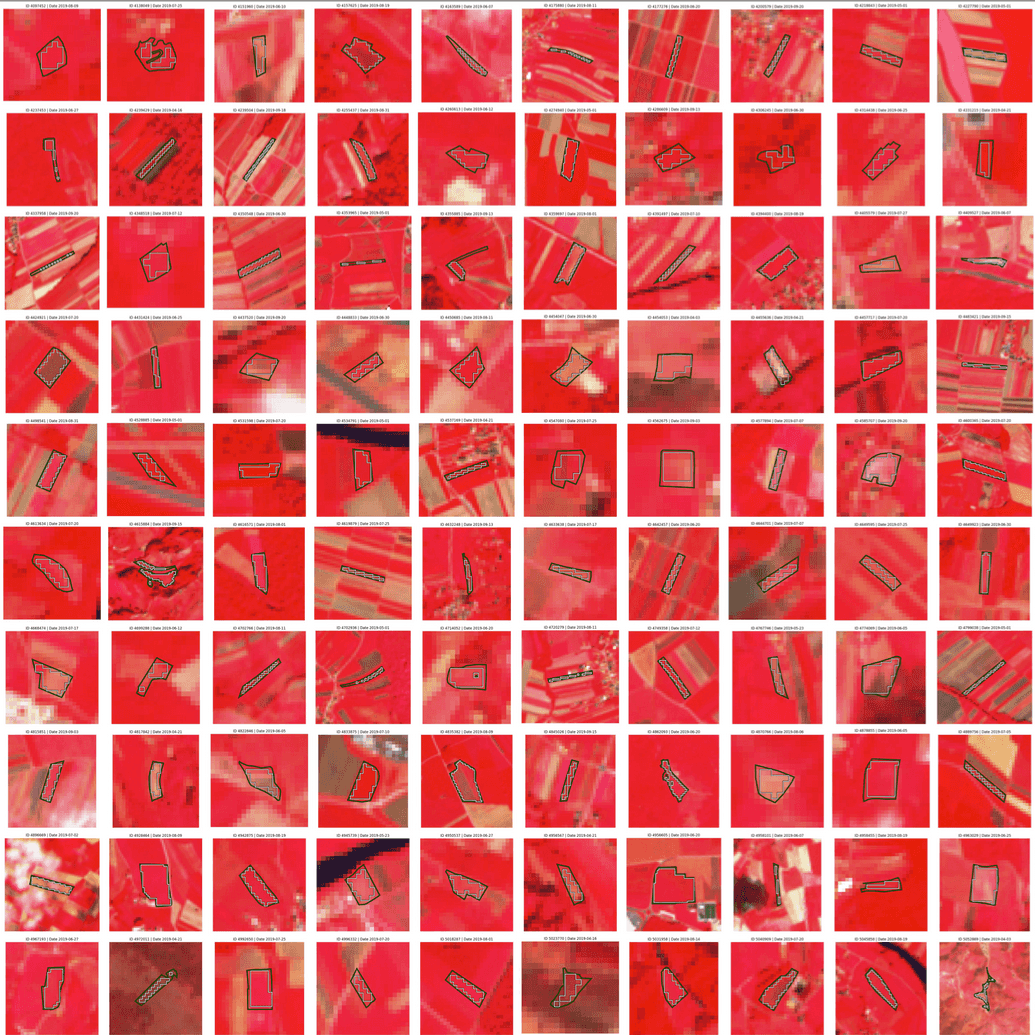
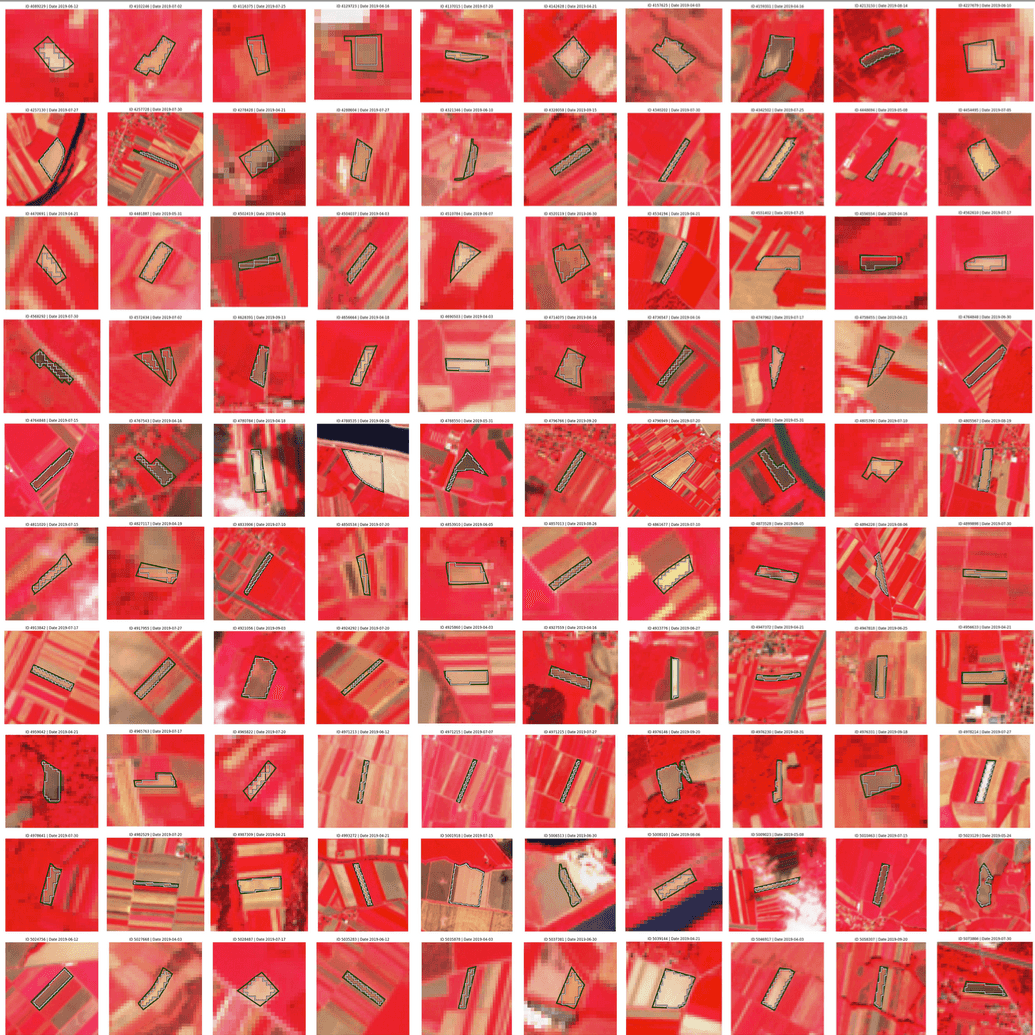
The bare-soil marker identifies all observations with exposed bare soil due to field being recently plowed, or due to non-photosynthetic vegetation cover. The latter can be a consequence of a harvest or vegetation drying up on the field. The event itself, being plowing or harvest, cannot be detected in satellite imagery, but its consequences are observable. Below we show random Sentinel-2 observations in false color labeled as bare soil or not bare soil (meaning that vegetation covers area of a FOI). Exposed bare soil looks brownish or grayish in false color, while presence of vegetation is indicated with red tones. Bare-soil marker assigns a probability to each valid Sentinel-2 observation that area of a FOI has exposed bare soil. All observations with bare-soil probability above user-defined threshold (here set to 0.8 on a scale between 0 and 1) are declared as bare-soil observations.
| Sentinel-2 observations of FOIs covered with vegetation | Sentinel-2 observations of FOIs with exposed bare soil |
|---|---|
|
|
Marker output
Bare-soil observations are marked with a vertical red lines in the signal time series chart at the bottom that shows time-series of NDVI signal in green and bare-soil probability in orange. Figure on the left shows false color S2 images and Figure on the right true color S2 images with bare-soil mask overlayed in red.
| False color visualization | Baresoil prediction mask |
|---|---|

|

|
Further info
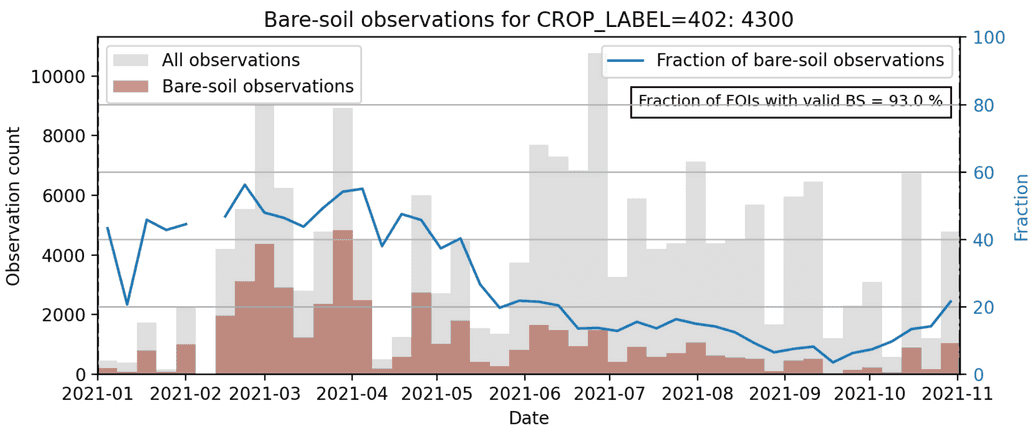
The time when an area of a FOI has exposed bare soil depends on the type of the crop that is being cultivated on the FOI and on farming practices. And results of the bare-soil marker can help us reveal these differences. Let's start by taking a closer look at temporal distribution of detected bare-soil observations for all cornfields. In the example above we can observe that bare soil is detected from beginning of the year until beginning of June and again in the second half of October. Long periods of exposed bare soil early in the year are very typical for cornfields in Slovenia. This can also be seen in the Figure below that shows temporal distribution of all observations in gray and bare-soil observations in brown of all FOIs claiming to grow corn. Blue line shows fraction of FOIs that have bare soil exposed on any given date. This fraction is high early in the season and at the end of the season and practically zero during the growing period of corn - between mid June and early October.
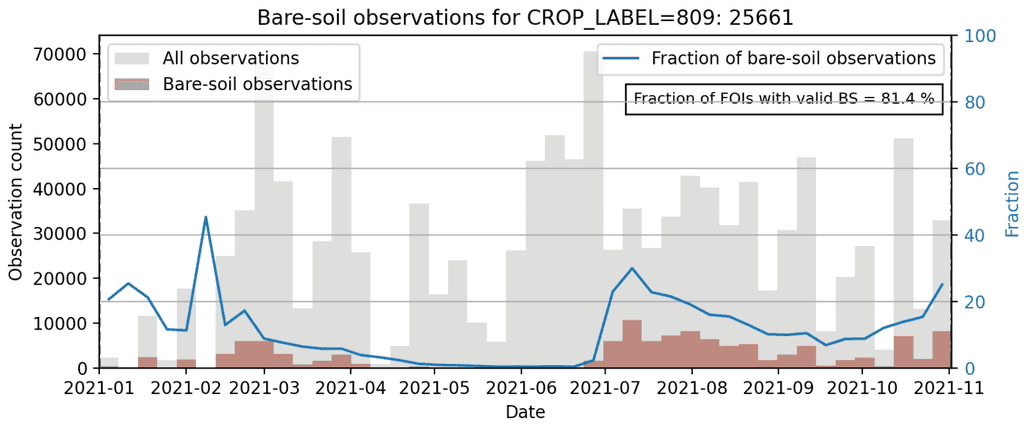
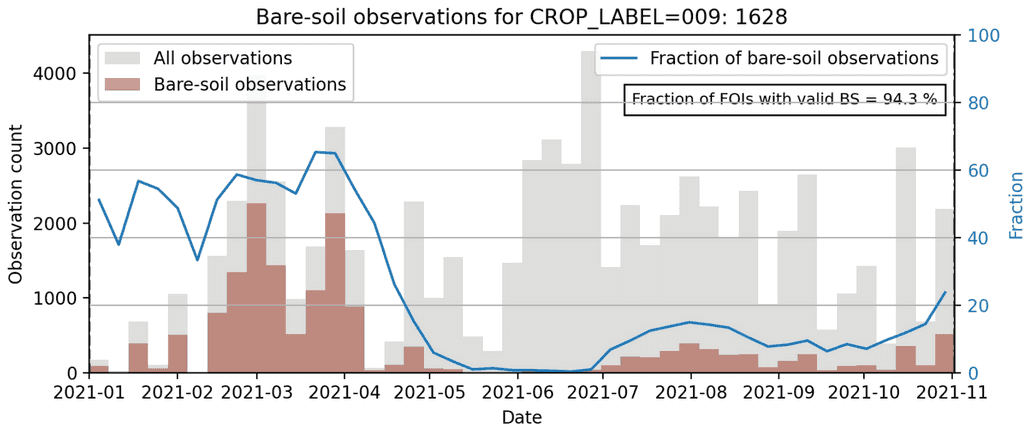
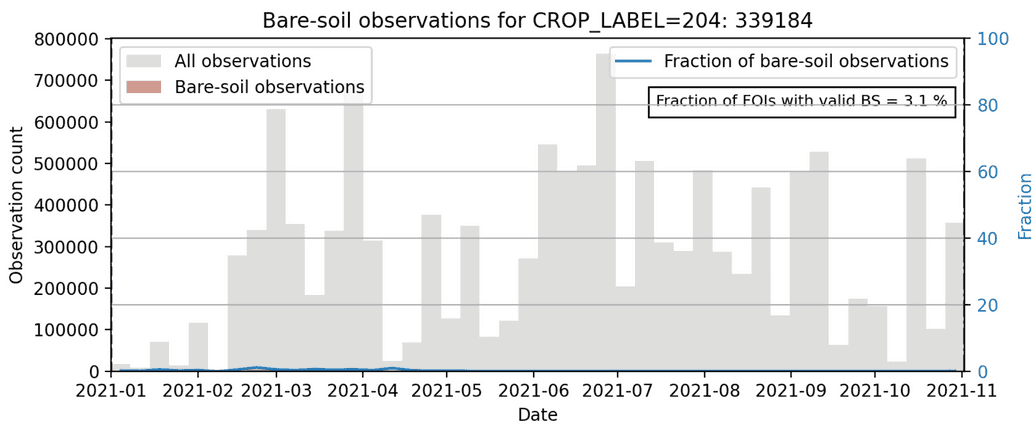
Other crop types are sown and harvested at different times which reflects in temporal distribution of detected bare-soil observations. In the table below we show the same plot as above for winter and summer barley, various vegetables, and permanent meadows. Winter and summer barley are sown in October of previous year and early March, respectively, which explains why the fraction of FOIs with exposed bare soil is much higher in the beginning of the year for summer barley. On the other hand there are no clear expectations for FOIs claiming to grow vegetables. Different kinds of vegetables can be sown and harvested at different times, often multiple times per season. Bare-soil observations are thus distributed throughout the year without any clear pattern. Permanent meadows are not expected to be plowed and to have exposed bare soil. The distribution shown below corroborates this.
| Winter barley | Summer barley |
|---|---|
|
|
| Various vegetables | Permanent meadows |
|
|
Above distribution show that bare-soil marker provides valuable input that can be used not only when assessing whether a FOI was farmed (plowed) or not, but also if the claim is consistent or not.
